
What the Future Holds for the UK in Terms of Climate Change
Likely the sea is going to rise about 10m then stop. It’s done that quite a few times in the past when nobody is around to monitor it. Global warming will likely pause for a while, maybe 10,000 years before rising another 10m.
Looking at the past million years data and a traffic analysis of the events, my guess is that the likeliest linear continuation of temperature and resultant CO2 levels and sea rise is 400 years starting around 1800 and finishing around 2200 when the CO2 level will probably be around 750ppm and the average temperature 4°C higher. The UK will generally be a lot wetter, a trend that has been continuing for 150 years. If you look at the actual data starting in 1851, not the modelling, then this suggests that. How reliable are the models? Not much. We have many of the studies using cyclic self-supporting calculations. Models calculating ice cores from biology and non-laboratory analyses that are based on carbon isotopes, that are based on rock structures and deposition that is based on current rate sea chemistry which are worked out from particle physics and average rates of decay, that are based on astronomical events and the earth’s and sun’s lives that are based on found rocks on earth that are based on fossils and evolution whose lives are determined by sea and land creatures where recent ones conform to carbon dating. In reality, we have sporadic information from around the mid-1800’s, certainly not global, moderate information from around the 1940’s, good global information from the 1970’s and excellent information from around 2000 with models to convert to previous years collection methods and dating things back a billion years based on that. For a 4.6 billion year old planet and 500 million years since multicellular oxygen based life occurred it’s not that much. Even for mammals it’s 350 million years, so say 60 years of good information, 50,000th of the time, is not much. So, a comparison would be at 8am, basing the whole of the last 50 years world climate on what I’ve experienced so far today where I live, everywhere, pole to pole. Anybody who has done modelling of data can choose the outcome they prefer, the current consensus having an unintentional maybe bias towards predicting disaster, and 99.999% of the data is constructed modelling and heavily interpreted by nearly always the same people. The overwhelming consensus is supported by most food technologists, animal behaviourists, dentists, theoretical physicists and oriental language specialists, so quite considerable and extensive with a wide band of experience in the narrow subject, and we even have letters of support from them to prove the validity. What counts as a scientist? Anyone whose status in the exclusive system they support and keeps them employed says they are. For the UK, the averages will increase, but that does not mean things are getting hotter, the highest temperatures usually remaining around the same, anomalies still occurring, now being measured more because everything is being measured more, but not judged as seriously with comparison earlier as they cease to be so different in numbers, the past having maybe twice a day measurements, today every second, thousands of times the scrutiny and monitoring, but the lowest temperatures will get less severe. This means a much milder climate with less low events, not a hotter one, but a milder one, possibly having the knock-on effect of higher general temperature anomalies and events.
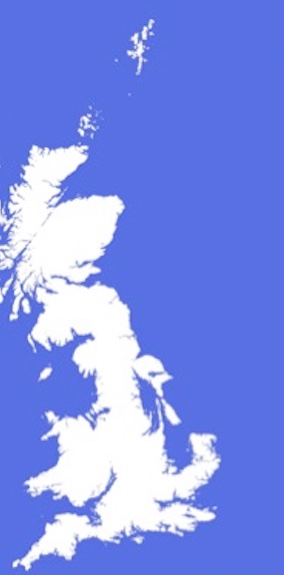
This suggest that the map below will be the likeliest outcome for the UK by the end of the century.
Screenshot